Mon–Sat 10:00–17:00 IST Bhiwani, Haryana 127306, India 1-Year On-Site Warranty
0%

Choosing a University Campus Electric Shuttle is not simply a matter of selecting a quiet vehicle with a clean exterior. The right choice must fit real campus routes, passenger demand, charging access, and the daily timetable. A shuttle that handles a short loop well may struggle during a steep, crowded evening run. Small details matter.

The International Energy Agency’s Global EV Outlook 2024 reported nearly 14 million electric car sales worldwide in 2023, about 18% of new car sales. That figure describes cars, not campus shuttles, so it should not be treated as a direct forecast for university fleets. Still, it shows how quickly electric transport is developing. The National Renewable Energy Laboratory’s evaluations of battery-electric transit buses also highlight practical factors such as energy use, operating conditions, and charging strategy. These are useful reference points, but campus routes need their own assessment.

This guide presents 10 tips for comparing vehicles, batteries, charging systems, accessibility, safety, service support, and total ownership costs. Start with actual route data: distance between stops, passenger loads, slope, weather, and time spent waiting. Ask suppliers for documented range and charging figures under conditions close to yours. Then check warranty terms and local maintenance capacity. A polished brochure is not enough. And the first estimate may be wrong. That is a reason to test assumptions, not to skip the analysis. A careful choice can make the shuttle more dependable for students, staff, and visitors while helping the university plan a practical transition to lower-emission transport.
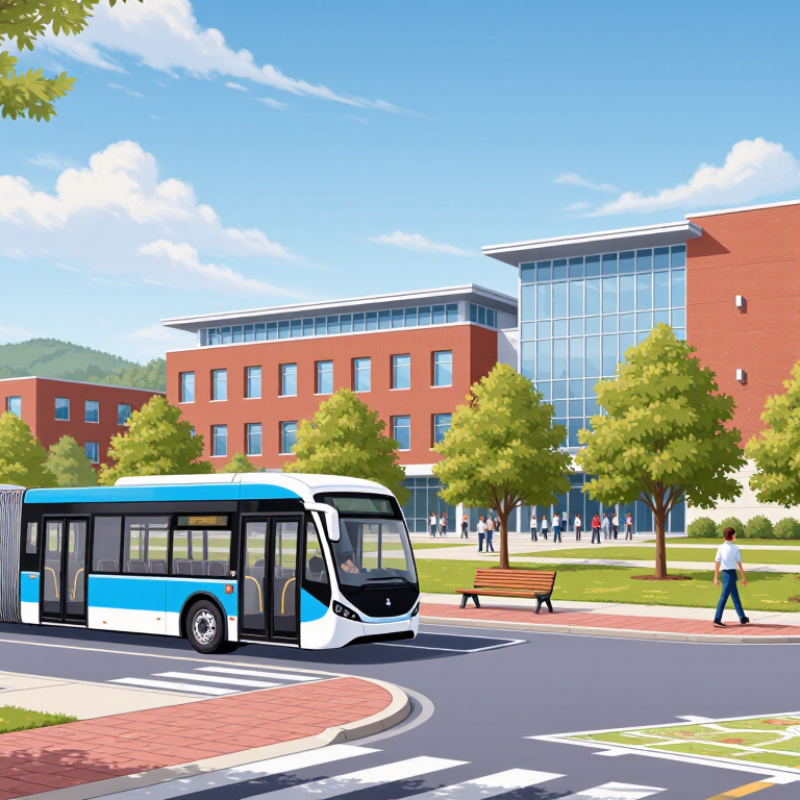
10 Tips for Choosing a University Campus Electric Shuttle

Map Daily Routes Against DOE’s 77% Electric-Drivetrain Efficiency Estimate

A campus shuttle’s route sheet can reveal more than its map. The U.S. Department of Energy cites roughly 77% efficiency for an electric drivetrain, meaning much of its energy can move the vehicle. Treat that figure as a benchmark, not a guarantee of whole-vehicle performance. Heating, cooling, hills, passenger loads, and charging losses affect real operations.

Map each shuttle’s daily loop by distance, stops, elevation, and time spent waiting. A flat, steady route between residence halls and classrooms may use energy differently from a hilly loop with crowded afternoon trips. Record energy use over several weeks, including cold mornings and hot afternoons. That matters. Compare measured use with the planned route, then keep a buffer for detours and unusually busy days.

Our first spreadsheet was too neat. It assumed every loop repeated perfectly, which campus traffic rarely does. A practical review should include the longest shift, the busiest pickup window, and where vehicles can recharge between runs. Ask drivers to flag recurring delays and steep sections. Those small details can make the efficiency estimate useful—or leave it as a number on paper.

Set Passenger Capacity and Meet ADA’s 30-by-48-Inch Clear-Space Standard

Before comparing shuttle models, estimate real passenger demand at the busiest times, not just average daily use. Count seated riders, any permitted standing capacity, and wheelchair users separately. A shuttle that looks spacious while empty can feel crowded when backpacks fill the aisle. Measure it.

Plan an unobstructed clear floor space at least 30 by 48 inches for a wheelchair user. Keep this area free of seats, bins, and other fixed obstacles, and check that riders can reach it along an accessible path. The 30-by-48-inch dimension is an important accessibility planning standard, but it does not by itself establish that a vehicle meets every applicable ADA requirement. Verify the vehicle configuration and relevant rules with a qualified accessibility specialist.

Test the layout on campus. Bring a tape measure, open the doors, and trace the path from the curb to the designated space. Check whether a folded stroller, a backpack, or a queue of boarding students would block access. Then ask wheelchair users to review the arrangement; drawings rarely reveal awkward turns or hard-to-reach restraints. Capacity estimates may need revision. Leave enough room for securement equipment and clear circulation, rather than counting every open inch as passenger space.

Match Charging Needs to SAE J1772 and CCS Connector Standards

Choosing a campus electric shuttle charger starts with the vehicle inlet, not the parking-space layout. In North America, SAE J1772 is commonly used for AC charging; CCS1 adds two DC contacts for faster charging. A shuttle parked overnight may work well with AC charging. A tight midday schedule may need CCS fast charging. Check the vehicle’s supported power and connector before specifying equipment. They are not interchangeable.

The International Energy Agency’s Global EV Outlook 2024 reports more than four million public charging points worldwide at the end of 2023, up over 40% in one year. That growth signals a larger charging ecosystem, but it does not guarantee a campus charger will match a shuttle. Tip: Ask the vehicle supplier for its inlet type, maximum AC and DC charging rates, and cable reach. Then test the proposed connector with the actual vehicle. Include winter gloves, rain, and a shuttle parked slightly off-center in the check.

One detail is easy to miss: a CCS inlet supports AC and DC, but charging speed still depends on the vehicle and charger. A high-rated unit cannot overcome a lower vehicle limit. Record connector type and charging time for each route. Leave room for errors in the first schedule; real dwell times can be messier than the spreadsheet.

Compare Energy Use with NREL Electric-Bus Performance Data

A campus shuttle’s energy use depends on more than its battery size. Route length, hills, passenger loads, heating, and air-conditioning all change the daily demand.

In its Foothill Transit battery-electric bus evaluation, the National Renewable Energy Laboratory reported energy consumption of about 2.3 kWh per mile for the evaluated buses. Treat that as a reference point, not a campus guarantee. Real routes differ. A short loop with frequent stops may use energy differently from a longer, steady route, even when both vehicles carry similar loads.

Ask suppliers for measured kWh per mile, then compare those figures against your own route logs. Record distance, passenger counts, outside temperature, and charging time over representative weeks. That matters. Calculate energy per passenger-mile as well as per vehicle-mile; an almost-empty shuttle can look efficient on paper while serving few riders.

I would also request winter and summer results, not just a polished average. NREL’s findings are useful, but they cannot replace a campus pilot. Uneven terrain, long idle periods, or crowded event trips may expose gaps in the estimate. Keep those uncertainties visible when sizing the battery and planning charging.

Estimate Lifecycle Costs Using FTA’s 12-Year Bus Useful-Life Benchmark

Use the Federal Transit Administration’s 12-year useful-life benchmark as a planning lens, not a guaranteed service life. It generally applies to large, heavy-duty transit buses; smaller vehicle classes may use different benchmarks. A campus shuttle’s actual lifespan depends on mileage, duty cycle, climate, and maintenance. Check the vehicle category before building your estimate.

Spread the purchase price across a 12-year model, then add charging equipment, electrical upgrades, energy, inspections, tires, repairs, and battery-related costs. Include downtime, too. A shuttle parked during a busy class change can require a backup vehicle or revised route. Stop-and-go trips may use fewer miles than city service, but frequent braking and door cycles still matter.

Use local figures where possible: utility bills, shop labor rates, route distances, and winter energy use. Compare annual costs, not just the initial quote. Battery performance and replacement timing are uncertain, so test several scenarios instead of assuming one outcome. Estimates are imperfect. Revisit them after the first year, when real charging and maintenance records reveal which assumptions were wrong.

FAQS

How should a campus estimate an electric shuttle’s daily energy use?

Map each route’s distance, stops, hills, and waiting time. Track energy use for several weeks, including cold mornings and hot afternoons. Treat drivetrain efficiency figures as benchmarks, not promises.

Why can two shuttle routes use different amounts of energy?

A flat loop between residence halls and classrooms differs from a crowded, hilly afternoon route. Heating, cooling, passenger loads, and charging losses also affect results. Small details matter.

What should a route review include before scheduling?

Check the longest shift, busiest pickup window, and available recharge periods. Ask drivers to flag steep sections and recurring delays. Our first spreadsheet assumed every loop repeated perfectly. It didn’t.

How should passenger capacity be estimated?

Count seated riders, permitted standing capacity, and wheelchair users separately during peak periods. Check whether backpacks crowd the aisle. An empty shuttle can be misleading.

What clear floor space should be planned for a wheelchair user?

Allow at least 30 by 48 inches of unobstructed floor space. Keep seats and bins clear, and check the accessible path to that space. Measure it.

How can staff check whether an accessible layout works in practice?

Open the doors and trace the path from curb to wheelchair space. Ask wheelchair users to review turns, reach, and securement equipment. Drawings may miss awkward spots.

How should a campus choose between AC and DC charging?

Check the shuttle’s inlet and supported charging rates first. Overnight parking may suit AC charging, while a tight midday schedule may need DC fast charging. They are not interchangeable.

What can affect charging time beyond the charger’s rated power?

The vehicle’s own charging limit can restrict speed. Test the actual connector, cable reach, and parking position, including rain and winter gloves. Leave room for schedule errors.

Conclusion

Choosing a University Campus Electric Shuttle starts with understanding how it will serve the campus each day. Map typical routes, distances, stops, and operating hours, then use the estimated 77% efficiency of electric drivetrains as a starting point for assessing energy needs. Set passenger capacity for busy periods while ensuring accessible boarding and a clear space of at least 30 by 48 inches. These practical requirements help narrow down vehicle size and layout before comparing models.

Next, check that charging equipment and vehicle connections are compatible with SAE J1772 or CCS standards, and compare expected energy use with electric-bus performance data. Include charging time and daily range in the assessment. Finally, look beyond the purchase price: estimate maintenance, energy, and replacement costs across the vehicle’s service life, using a 12-year bus useful-life benchmark to build a more complete lifecycle-cost estimate.

Ethan

Ethan

Ethan is a dedicated marketing professional with a strong understanding of the company’s products, customers, and industry landscape. Through his practical experience and thoughtful approach, he transforms complex product information into clear, useful insights that help readers make confident......